EXPLAINER GRAPHICS
Visualize Your Information

EXPLAINER GRAPHICS

Visualize Your Information
Transform complex ideas and processes into engaging visual stories.
Explainer.Graphics creates visuals and illustrates information graphics that communicate complex ideas clearly and effectively.
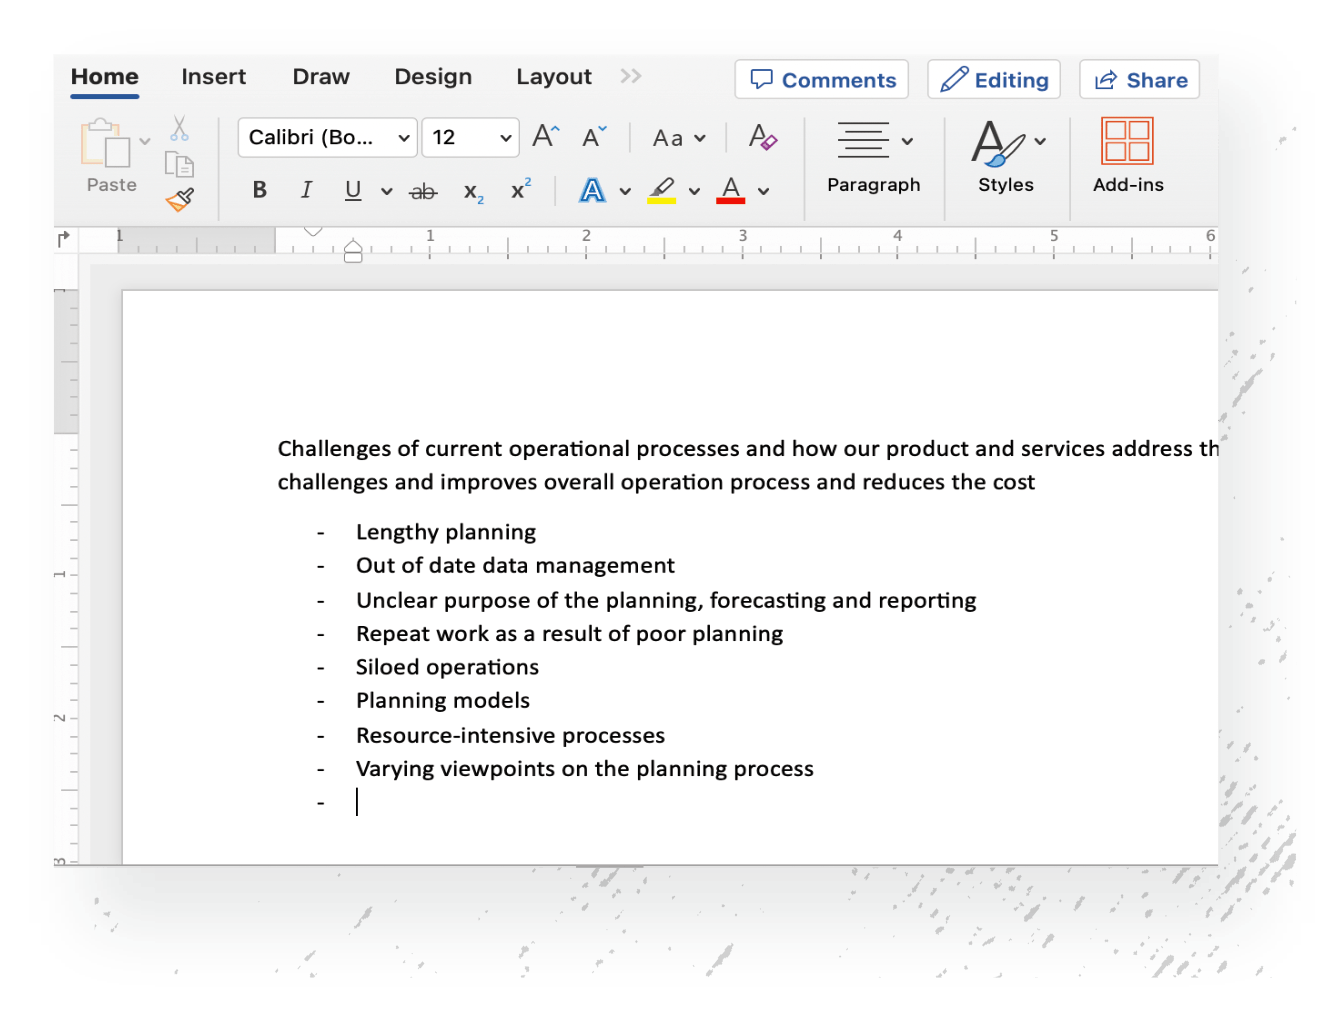
Your documents and text visualized into information graphics.
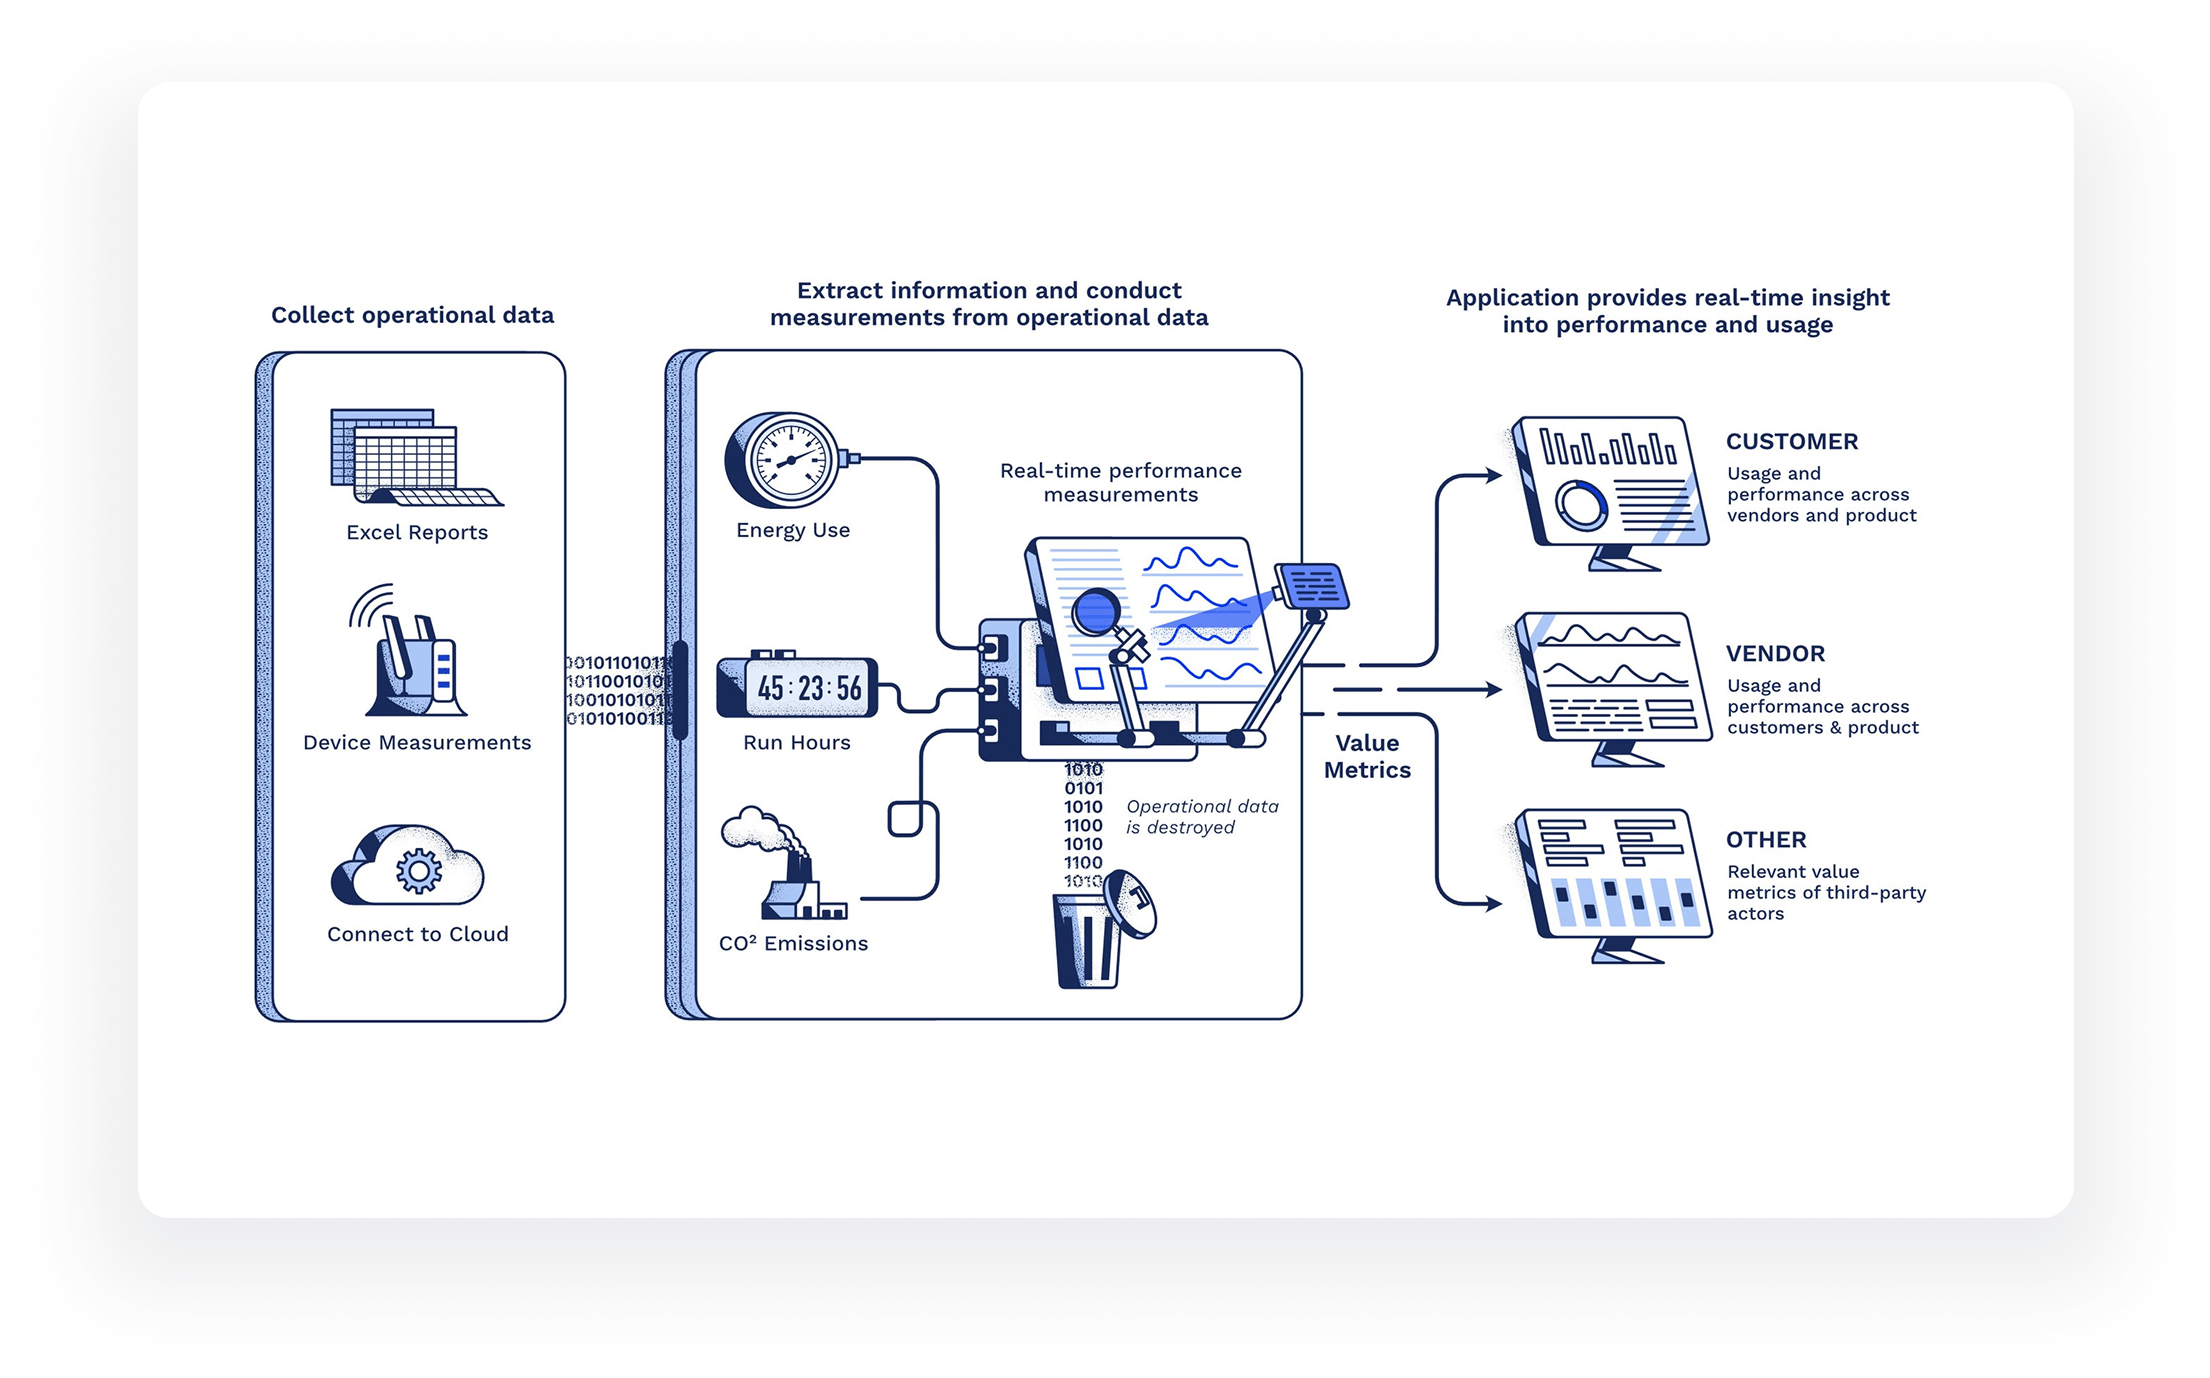
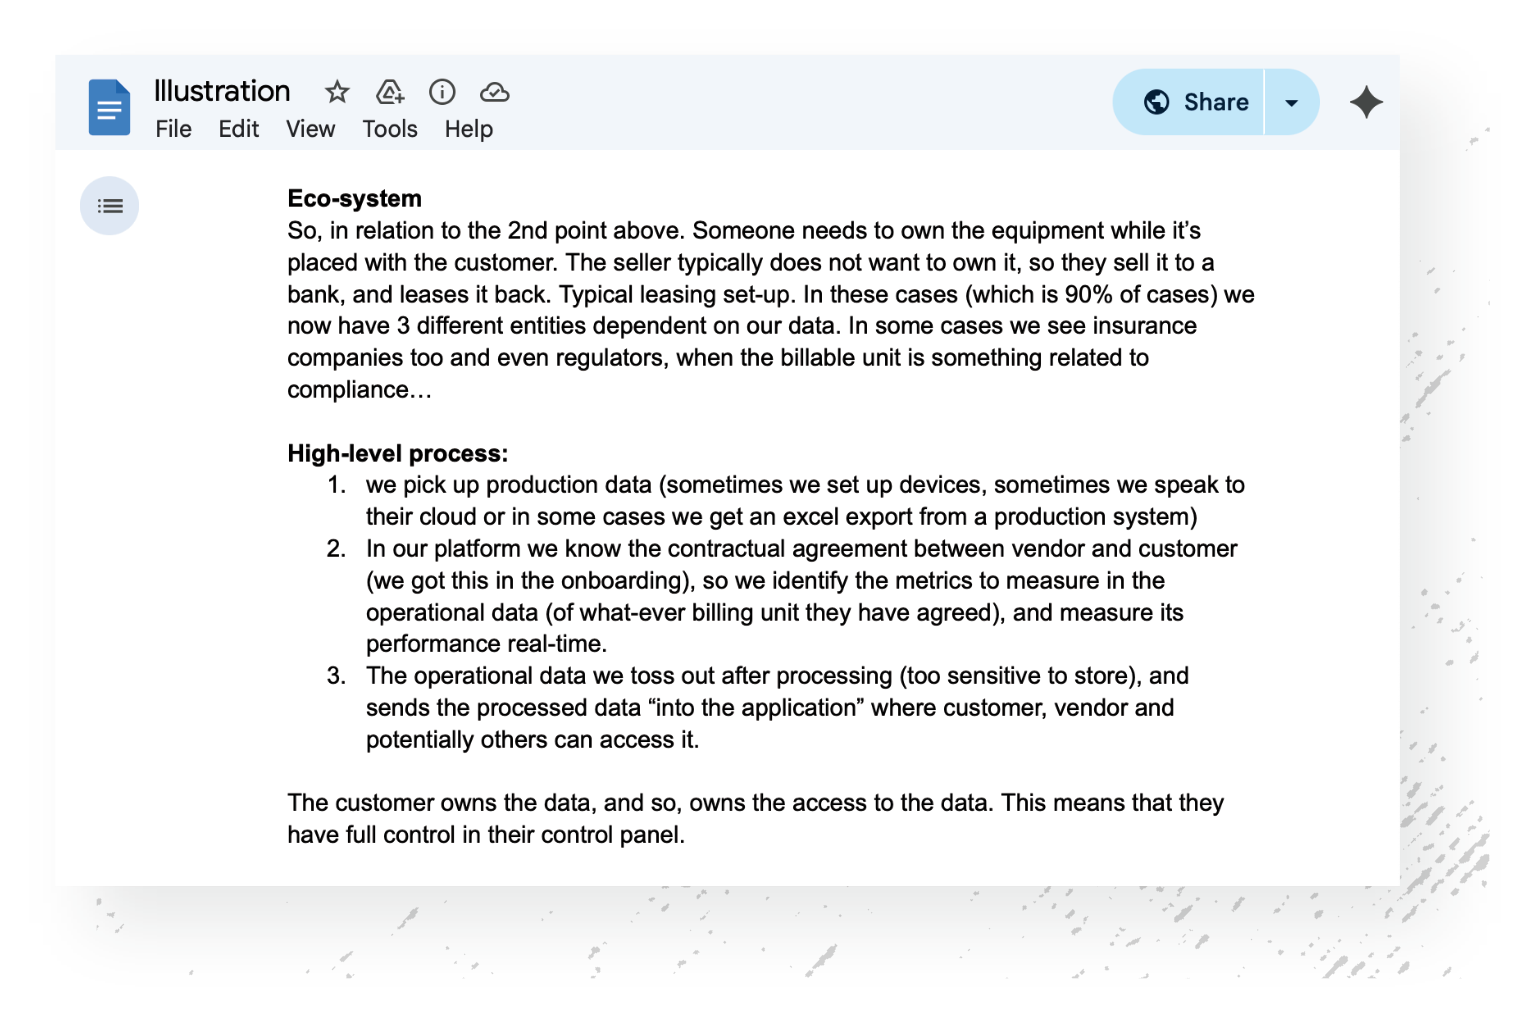
Illustration of your concepts and ideas into impactful visuals
Conceptual illustrations

Visualize your process documents and slides

Explainer Illustrations

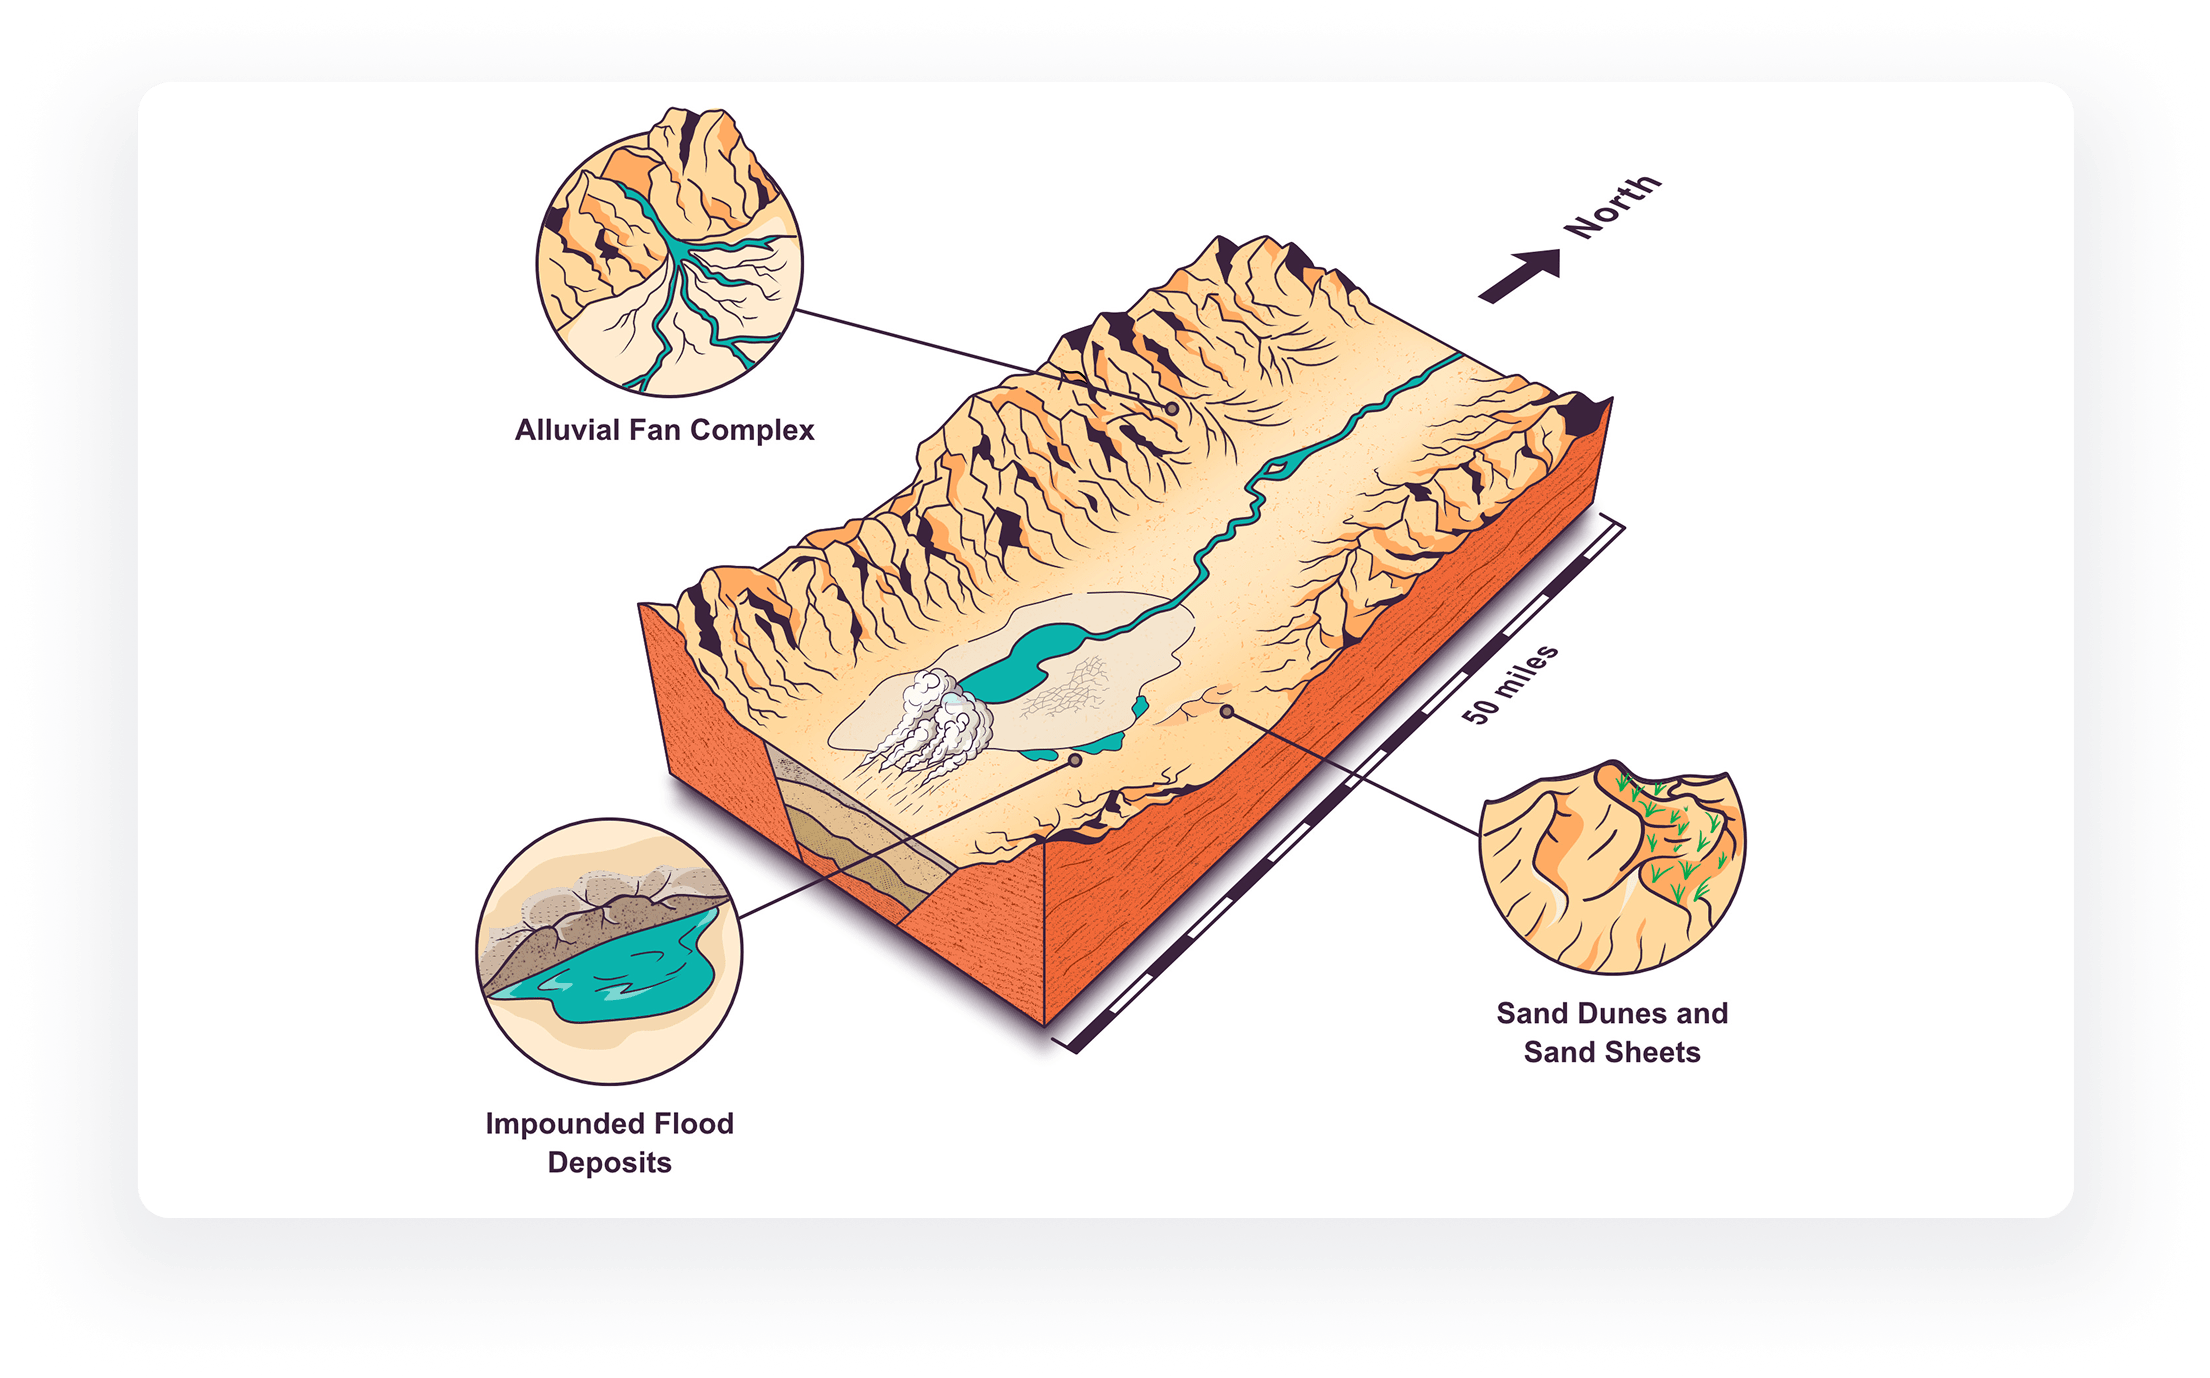
A series of infographics and flow chart illustrations for National Academies of Science research publications

Concept illustration of a data analytics process that involves various tools and software. This illustration was made to visually describe the process and tell a story as a part of a pitch.

Explainer illustration for the software that gives real time insight into performance.

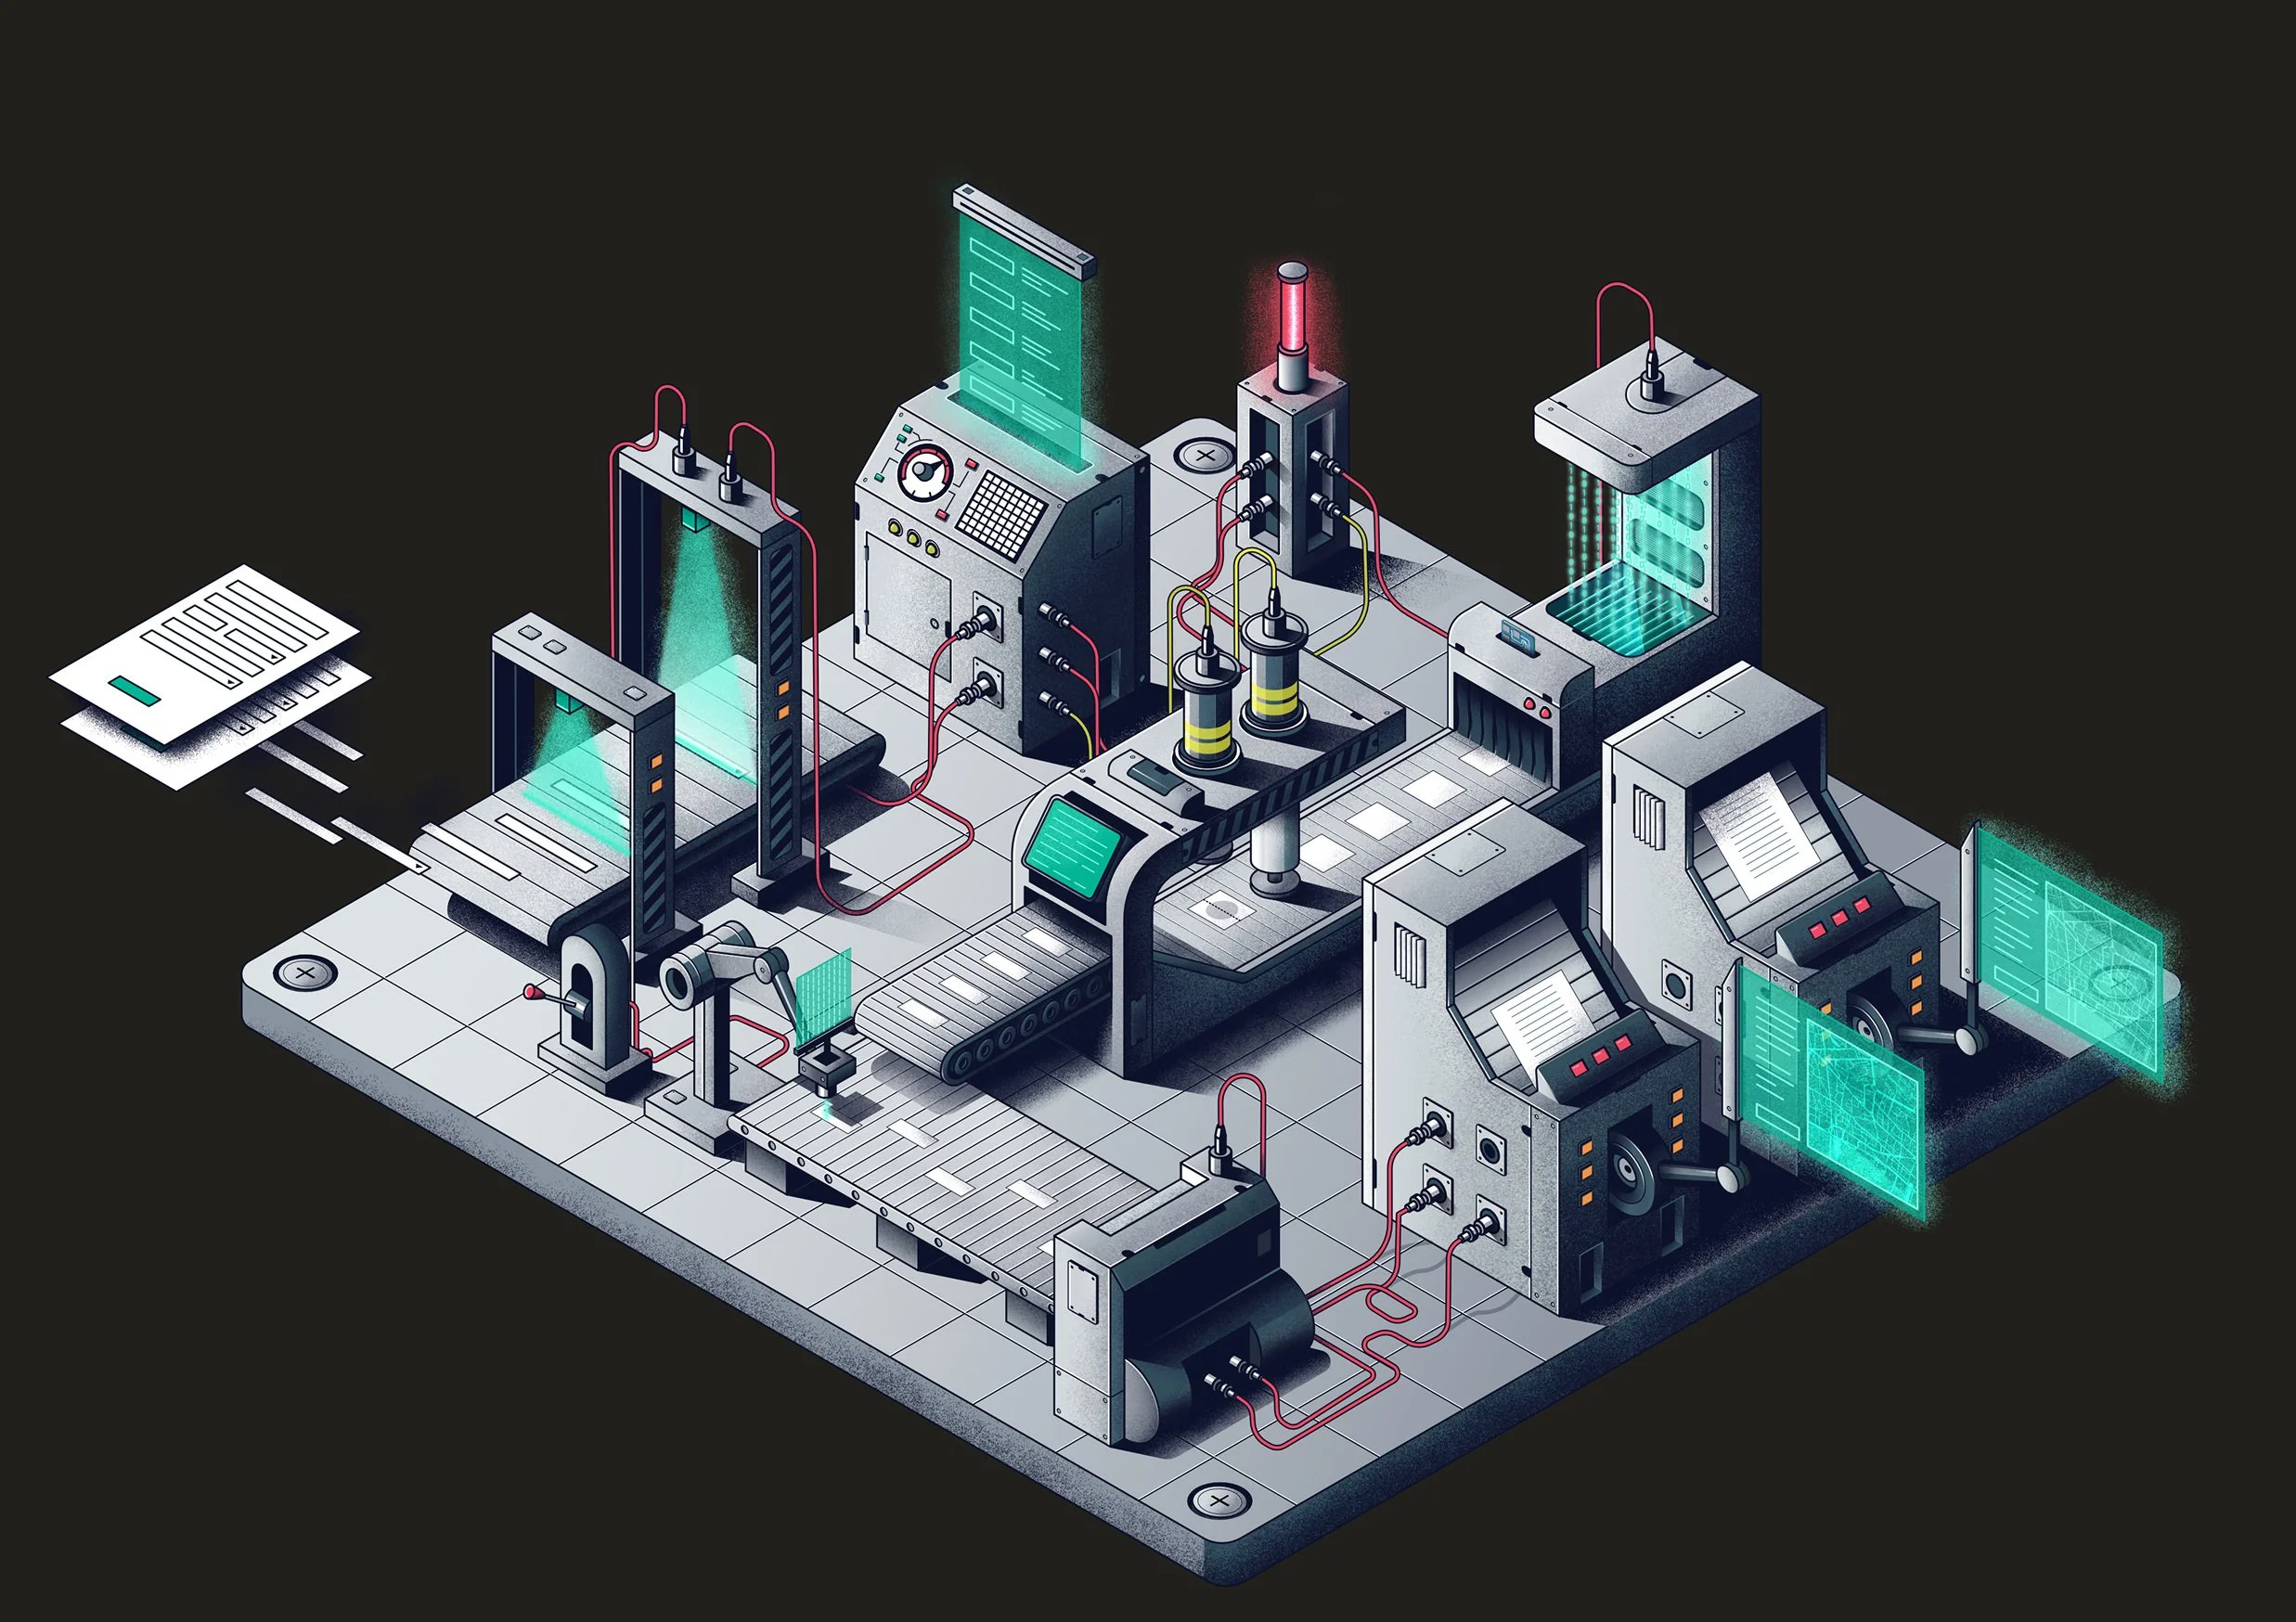
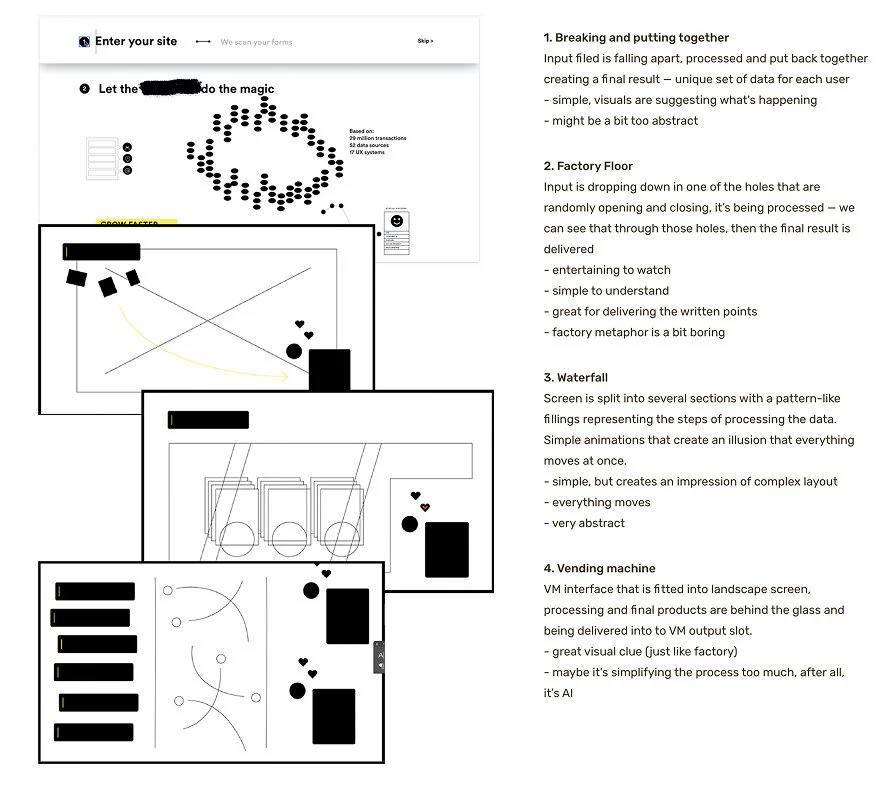
An illustration for a data processing product website. The goal was to show how machines and AI do the processing and data extraction from various forms.
So what are the benefits to you?
Decision Support:
Help your audience understand the step-by-step procedures or workflows, facilitating decision support.
Time Efficiency:
Enable faster understanding of concepts and processes, saving time compared to reading lengthy texts.
Increased Engagement:
Capture attention more effectively than plain text, encouraging users to engage with the content
Learning Enhancement:
Help facilitate learning by guiding individuals through processes or concepts.
I work with:
-
I create explainer graphics that contribute to improved communication, understanding, and engagement across various aspects of business operations, marketing, collaboration and decision making.
-
Assist nonprofit organizations in presenting their impact and results in a visually compelling way to stakeholders and donors.
-
Help create engaging educational materials, presentations and reports.
-
Work with government agencies to enhance public communication, increase transparency, and improve overall efficiency in delivering services and information to citizens.
